Microsoft Excel 2019
Microsoft Excel is an electronic spreadsheet. You can use Excel to organize your data into rows and columns and to perform mathematical calculations. An Excel spreadsheet can contain workbooks and worksheets.
माइक्रोसॉफ्ट एक्सेल 2019
माइक्रोसॉफ्ट एक्सेल एक इलेक्ट्रॉनिक स्प्रेडशीट है। आप अपने डेटा को पंक्तियों और स्तंभों में व्यवस्थित करने और गणितीय परिकलन करने के लिए एक्सेल का उपयोग कर सकते हैं। एक्सेल स्प्रेडशीट में वर्कबुक और वर्क्शीट हो सकते हैं।
What is Spreadsheet?
A spreadsheet is an electronic document that stores various types of data. There are vertical columns and horizontal rows. A cell is where the column and row intersect. A cell can contain data and can be used in calculation of data within the spreadsheet.
स्प्रेडशीट क्या है?
स्प्रेडशीट एक इलेक्ट्रॉनिक दस्तावेज़ है जो विभिन्न प्रकार के डेटा को संग्रहीत करता है। जिनमें वर्टिकल कॉलम और होरीजॉन्टल रॉ कहलाते हैं। एक सेल वह जगह होता है जहाॅं कॉलम और रॉ एक दुसरे से मिलते हैं। सेल में डेटा को रखा जाता है और स्प्रेडशीट में कैल्कूलेशन के लिए इन सेल का प्रयोग क्या जाता है।
How to Open MS-Excel 2019
Press Win key From Keyboard and Type Excel
Or
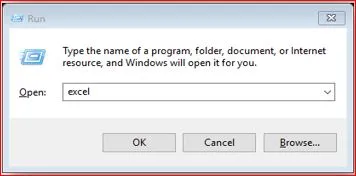
Press Win+R to open Run command Dialog Box then Type “Excel” and press Enter key.
MS-Excel 2019 को कैसे खोलें
कीबोर्ड से विंडो की दबाएँ और Excel टाइप करें
या
रन कमांड डॉयलॉग बॉक्स खोलने के लिए Win+R दबाएँ, फिर "Excel" टाइप करें और इंटर की दबाएँ। एक्सल ऑपेन हो जायेगा।MS-Excel
2019 Interface
MS-Excel
2019 इंटरफ़ेस
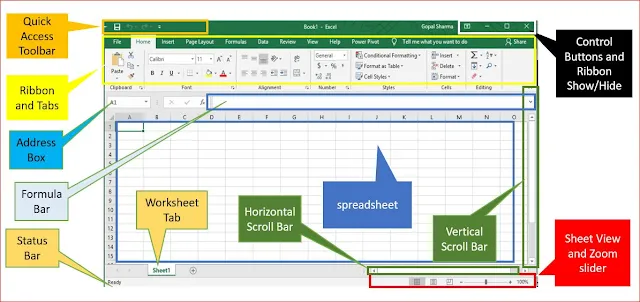
MS-Excel 2019 Screen
Components
MS-Excel 2019 स्क्रीन कॉम्पोनेन्टस
The Ribbon
The Ribbon contains all of the commands you will need to perform common tasks in Excel. It has multiple tabs, each with several groups of commands.
रिबन
रिबन में वे सभी आदेश होते हैं जिनकी आपको Excel में सामान्य कार्य करने के लिए आवश्यकता होगी. इसमें कई टैब हैं, जिनमें से प्रत्येक में कमांड के कई समूह हैं।
Showing and hiding the Ribbon
If you find that the Ribbon takes up too much screen space, you can hide it. To do this, click the Ribbon Display Options arrow in the
upper-right corner of the Ribbon, then select the desired option from the
drop-down menu.
रिबन दिखाना और छिपाना
यदि आप पाते हैं कि रिबन बहुत अधिक स्क्रीन स्पेस लेता है, तो आप इसे छिपा सकते हैं। ऐसा करने के लिए, रिबन के ऊपरी-दाएँ कोने में रिबन डिस्प्ले ऑप्शन तीर पर क्लिक करें, फिर ड्रॉप-डाउन मेनू से वांछित विकल्प का चयन करें।
Auto-hide Ribbon: Auto-hide displays your workbook in full-screen mode and completely hides the Ribbon from view. To show the Ribbon, click the Expand Ribbon command at the top of screen.
Show Tabs: This option hides all command groups when they're not in use, but tabs will remain visible. To show the Ribbon, simply click a tab.
Show Tabs and Commands: This option maximizes the Ribbon. All of the tabs and commands will be visible. This option is selected by default when you open Excel for the first time.
ऑटो-हाइड रिबन: ऑटो-हाइड आपकी वर्क बुक को फुल-स्क्रीन मोड में प्रदर्शित करता है और रिबन को दिखने से पूरी तरह से छुपाता है। रिबन दिखाने के लिए, स्क्रीन के उपर इक्स्पैन्ड रिबन कमांड पर क्लिक करें।
शो टैब : यह विकल्प सभी कमांड ग्रुप्स को छुपाता है जब वे उपयोग में नहीं होते हैं, लेकिन टैब दिखाई देते रहेंगे। रिबन दिखाने के लिए, बस एक टैब पर क्लिक करें।
शो टैब एण्ड कमांडस: यह विकल्प रिबन को मक्सीमइज़ेस करता है. सभी टैब और कमांड दिखाई देंगे। जब आप पहली बार Excel खोलते हैं, तो यह विकल्प डिफ़ॉल्ट रूप से चयनित होता है.

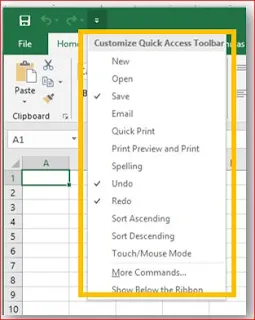
The Quick Access Toolbar
The Quick Access Toolbar lets you access common commands no matter which tab is selected. By default, it includes the Save, Undo, and Redo commands.
क्विक एक्सेस टूलबार
क्विक एक्सेस टूलबार आपको सामान्य आदेशों तक पहुंचने देता है, इससे कोई फर्क नहीं पड़ता कि कौन सा टैब चुना गया है। डिफ़ॉल्ट रूप से, इसमें सेव, अन्डू करें और रीडो आदेश शामिल हैं।
Tell Me
The Tell me bar allows you to search for commands, which is especially helpful if you don't remember where to find a specific command.
टेल मी
टेल मी बार आपको कमांड को सर्च करने की अनुमति देता है, जो विशेष रूप से सहायक है यदि आपको याद नहीं है कि एक स्पिसिफिक कमांड कहां मिलेगा।
Command Groups
Each group contains a series of different commands. Simply click any command to apply it. Some groups also have an arrow in the bottom-right corner, which you can click to see even more commands.
कमांड ग्रुप्स
प्रत्येक ग्रुप में विभिन्न कमांडस की एक सीरीज होती है। बस इसे अप्लाई करने के लिए किसी भी कमांड पर क्लिक करें। कुछ ग्रुप्स में निचले-दाएं कोने में एक तीर भी होता है, जिसे आप और भी अधिक कमांड देखने के लिए क्लिक कर सकते हैं।
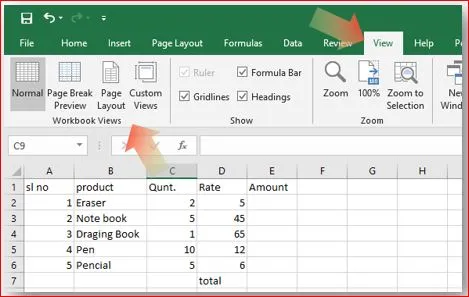
The Worksheet views bar
Normal view is the default view for all worksheets in Excel.
Page Layout view displays how your worksheets will appear when printed. You can also add headers and footers in this view.
Page Break view allows you to change the location of page breaks, which is especially helpful when printing a lot of data from Excel.
वर्कशिट व्यू बार
नॉर्मल व्यू इक्सेल में सभी वर्कशीट्स के लिए नॉर्मल व्यू डिफ़ॉल्ट व्यू है।
पेज लेआउट व्यू दिखाता है कि प्रिन्ट होने पर आपके वर्कशीट्स कैसे दिखाई देंगे. आप इस व्यू में हेडरस और फूटरस भी जोड़ सकते हैं.
पेज ब्रेक व्यू आपको पेज ब्रेक का स्थान बदलने की अनुमति देता है, जो एक्सेल से बहुत सारे डेटा प्रिंट करते समय विशेष रूप से सहायक होता है।
The Zoom bar
Zoom Control
Click and drag the slider to use the zoom control. The number to the right of the slider bar reflects the zoom percentage.
ज़ूम कंट्रोल
ज़ूम कंट्रोल का उपयोग करने के लिए स्लाइडर को क्लिक करें और खींचें. स्लाइडर बार के दाईं ओर की संख्या ज़ूम प्रतिशत को दर्शाती है।
The Status Bar
Status Bar locate at the bottom of Workbook window. Sum, Average, count are display auto after selecting cells. You can also find the CAPS Lock status and Number Lock status here.
स्टैटस बार
स्टैटस बार वर्कबुक विंडो के निचले भाग में स्थित होते है. सेल्स को सिलेक्ट करने के बाद सम, एवरैज , काउन्ट दिखाई देती है. आप यहां कैप्स लॉक स्टैटस और नंबर लॉक स्टैटस भी देख सकते हैं।
Backstage view
Backstage view gives you various options for saving, opening a file, printing, and sharing your Workbook. To access Backstage view, click the File tab on the Ribbon.
बैकस्टेज व्यू
बैकस्टेज व्यू आपको अपनी वर्कबुक सेव, ओपन , प्रिंट करने और शेयर करने के लिए विभिन्न विकल्प देता है. बैकस्टेज व्यू तक पहुँचने के लिए, रिबन पर फ़ाइल टैब क्लिक करें।
Back to Normal View
Backstage view after click on File tab, Click on Back button to back to normal view
बैकस्टेज व्यू फ़ाइल टैब पर क्लिक करने के बाद नॉर्मल व्यू पर वापस जाने के लिए बैक बटन पर क्लिक करें
Backstage view Options
बैकस्टेज व्यू ऑप्शन
Return to Excel रिटर्न तो इक्सेल
You can use the arrow to close Backstage view and return to Excel.
बैकस्टेज व्यू बंद करने और इक्सेल पर लौटने के लिए आप तीर का उपयोग कर सकते हैं.
Infoइन्फो
The Info pane will appear whenever you access Backstage view. It contains information about the current workbook.
जब भी आप बैकस्टेज व्यू पर पहुँचते हैं, तो इन्फो पेन दिखाई देगा. इसमें वर्तमान वर्क बुक के बारे में जानकारी होती है.
New न्यू
From here, you can create a new blank workbook or choose from a large selection of templates.
यहां से, आप एक न्यू ब्लैंक वर्कबुक बना सकते हैं या टेम्पलेट्स के बड़े चयन में से चुन सकते हैं।
Open ओपन
From here, you can open recent workbooks, as well as workbooks saved to your OneDrive or on your computer.
यहाँ से, आप हाल की वर्कबुकस खोल सकते हैं, साथ ही अपने OneDrive या अपने कंप्यूटर पर सेव की गई वर्कबुकस खोल सकते हैं.
Save and Save As सेव एण्ड सेव अस
Use Save and Save As to save your workbook to your computer or to your OneDrive.
सेव एण्ड सेव अस का उपयोग अपनी वर्कबुक को अपने कंप्यूटर या अपने OneDrive पर सेव करने के लिए कर सकते हैं
Print प्रिंट
From the Print pane, you can change the print settings and print your workbook. You can also see a preview of your workbook.
प्रिंट पेन से, आप प्रिंट सेटिंग्स परिवर्तित कर सकते हैं और अपनी वर्कबुक प्रिंट कर सकते हैं. आप अपनी वर्कबुक का प्रीव्यू भी देख सकते हैं.
Share शेयर
From here, you can invite people to view and collaborate on your workbook. You can also share your workbook by emailing it as an attachment.
यहाँ से, आप लोगों को अपनी वर्कबुक को देखने और उस पर सहयोग करने के लिए आमंत्रित कर सकते हैं. आप अपनी वर्कबुक को अटैचमेंट के रूप में ईमेल करके भी साझा कर सकते हैं.
Export एक्सपोर्ट
You can choose to export your workbook in another format, such as PDF/XPS or Excel 1997-2003.
आप अपनी वर्कबुक को किसी अन्य फॉर्मैट, जैसे PDF/XPS या Excel 1997-2003 में एक्सपोर्ट करना चुन सकते हैं.
Close क्लोज़
Click here to close the current workbook.
वर्तमान वर्कबुक को बंद करने के लिए यहाँ क्लिक करें.
Account अकाउंट
From the Account pane, you can access your Microsoft account information, modify your theme and background, and sign out of your account.
खाता पेन से, आप अपनी Microsoft खाता की जानकारी तक पहुँच सकते हैं, अपनी थीम और बैकग्राउंड संशोधित कर सकते हैं, और अपने खाते से साइन आउट कर सकते हैं.
Options ऑप्शनस
Here, you can change various Excel options, settings, and language preferences.
यहां, आप विभिन्न इक्सेल ऑप्शन, सेटिंग्स और भाषा प्रेफ्रन्स बदल सकते हैं.
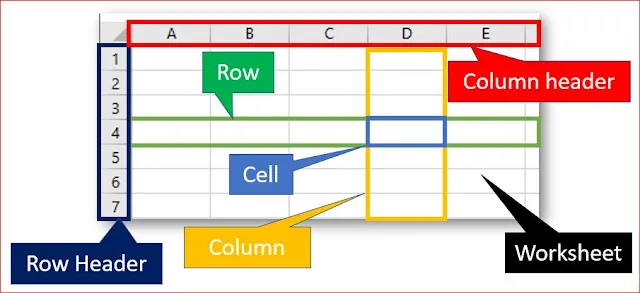
Worksheet Overall
Some Fact about Excel
Excel के बारे में कुछ तथ्य
Work Book: -
MS Excel File known as Workbook and extension is (.xlsx). A workbook is collection of worksheets.
वर्क बुक :-
MS Excel फ़ाइल को वर्कबुक और इसका एक्सटेंशन (.xlsx) के रूप में जाना जाता है. वर्कबुक, वर्क्शीटस का संग्रह है।
Worksheet: -
A Worksheet consists Columns and Rows and the intersection of Column and Row is known as cell. So, a worksheet is group of cells.
वर्क्शीट :-
एक वर्क्शीट में कॉलम और रो होती हैं और कॉलम और रो के इनर्सेक्शन को सेल के रूप में जाना जाता है. तो एक वर्क्शीट सेल का समूह है।
Total Number of Column in a worksheet :- 16,384 & Last header is (XFD)
Total Number of Row in a Worksheet :- 10,48,576
Total Number of Cell in a worksheet :-16384 x 1048576 = 17,17,98,69,184 cells
Total Number of sheet in a workbook :- Unlimited
Default Number of worksheets when a workbook load :- 1 worksheet
वर्कशीट में कॉलम की कुल संख्या:- 16,384 & अंतिम हेडर (XFD) है
वर्कशीट में रो की कुल संख्या:- 10,48,576
वर्कशीट में सेल की कुल संख्या:-16384 x 1048576 = 17,17,98,69,184
वर्कबुक में सीट की कुल संख्या:- असीमित
वर्कबुक लोड होने पर वर्कशीट की डिफ़ॉल्ट संख्या:- 1 वर्कशीट
Starting Work in Excel
Excel files are called workbooks. Whenever you start a new project in Excel, you'll need to create a new workbook. There are several ways to start working with a workbook in Excel. You can choose to create a new workbook either with a blank workbook or a redesigned template or open an existing workbook.
Excel में कार्य प्रारंभ करना
Excel फ़ाइलों को वर्कबुक कहा जाता है. जब भी आप Excel में कोई नया प्रोजेक्ट प्रारंभ करते हैं, तो आपको एक नई वर्कबुक बनानी होगी. Excel में किसी वर्कबुक के साथ कार्य प्रारंभ करने के कई तरीके हैं. आप या तो ब्लैंक वर्कबुक या पूर्वडिज़ाइन किए गए टेम्पलेट के साथ एक नई वर्कबुक बनाना
To create a new blank workbook
Click the File tab.
Backstage view will appear. Select New, then click Blank workbook. A new blank workbook will appear.
न्यू ब्लैंक वर्कबुक बनाने के लिए
फ़ाइल टैब पे क्लिक करें।
बैकस्टेज व्यू दिखाई देगा। न्यू चुनें, फिर ब्लैंक वर्कबुक क्लिक करें. एक न्यू ब्लैंक वर्कबुक दिखाई देगी.
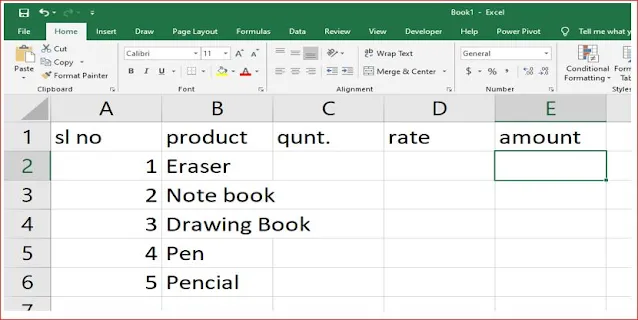
Entering Data in Worksheet
There are different ways to enter data in Excel
To enter data through active cell:
Click in the cell where you want to the data
Begin typing
To enter data through the formula bar:
Click the cell where you would like the data
Place the cursor in the Formula bar and begin typing
वर्क्शीटक में डेटा एंट्री करना
एक्सेल में डेटा एंट्री करने के अलग-अलग तरीके हैं
ऐक्टिव सेल के माध्यम से डेटा दर्ज करने के लिए:
उस सेल में क्लिक करें जहाँ आप डेटा चाहते हैं और बस लिखना शुरू करें
फार्मूला बार के माध्यम से डेटा दर्ज करने के लिए:
उस सेल को क्लिक करें जहाँ आप डेटा चाहते हैं फिर कर्सर को फॉर्मूला बार में रखें और लिखना शुरू करें।
Project 1
To Save a workbook
Click the File tab. Backstage view will appear. Click on Save, Choose your location then type a name for your file and click on Save Button
वर्कबुक को सेव करने के लिए
फ़ाइल टैब पे क्लिक करें। बैकस्टेज व्यू दिखाई देगा। सेव पर क्लिक करें, अपना लोकेशन चुनें फिर अपनी फ़ाइल के लिए एक नाम टाइप करें और सेव बटन पर क्लिक करें
To Open an existing workbook
Click the File Tab --> Open than click on your file name form content window of Open dialog box and click on Open button.
किसी मौजूदा वर्कबुक को खोलने के लिए
फ़ाइल टैब पे क्लिक करें --> उसके बाद ओपन पर क्लिक करे फिर ओपन डाइअलॉग बॉक्स के कॉन्टेन्ट विंडो से अपनी फ़ाइल के नाम पर क्लिक करें, फिर ओपन बटन पर क्लिक करें।
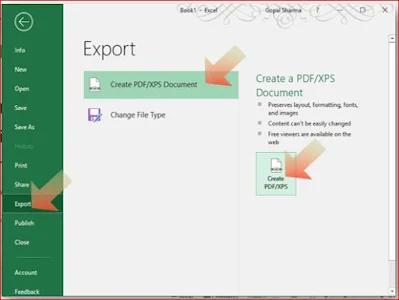
Export as PDF or XPS
Some time we need to Save our Workbook as PDF or XPS format to share or Save for later.
To Export Your Workbook as PDF or XPS format
Click the File Tab --> Export than click on Create PDF/XPS button.
PDF या XPS के रूप में एक्सपोर्ट करें
कभी कभी हमें अपनी वर्कबुक को PDF या XPS फॉर्मैट के रूप में सेव करने के बाद उसे शेयर करने की आवश्यकता होती है.
अपनी वर्कबुक को PDF या XPS फॉर्मैट के रूप में एक्सपोर्ट करने के लिए
फ़ाइल टैब क्लिक करें --> फिर एक्सपोर्ट पर क्लिक करें, फिर PDF/XPS बटन पर क्लिक करें।
Export as PDF or XPS
After clicking on Create PDF /XPS button choose your location and type a name for your Exported file From Export Dialog box. And click on Publish button to finish this task.
PDF या XPS के रूप में एक्सपोर्ट करें
Create PDF /XPS बटन पर क्लिक करने के बाद अपना स्थान चुनें और एक्सपोर्ट डाइअलॉग बॉक्स से अपनी एक्सपोर्ट की गई फ़ाइल के लिए एक नाम लिखें। और इस कार्य को पूरा करने के लिए पब्लिश बटन पर क्लिक करें।
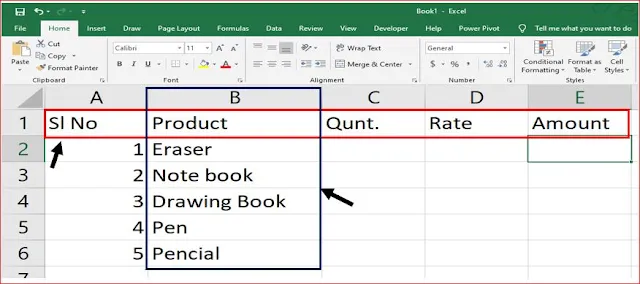
Edit Data in Cell
Excel provide three way to edit data.
Double click on cell which data you want to edit. or
Click on cell than press F2 from Keyboard or
Click on cell which data you want to edit than click on formula bar to edit data
After edit press Enter to accept the change,
Press Esc to Reject the changes.
सेल में डेटा को एडिट करना
Excel डेटा एडिट करने के तीन तरीके प्रदान करता है.
उस सेल पर डबल क्लिक करें जिसे आप एडिट करना चाहते हैं. या
कीबोर्ड से सेल पर क्लिक करें फिर F2 की दबाएँ या
उस कक्ष पर क्लिक करें जिसे आप एडिट करना चाहते हैं, फिर डेटा एडिट करने के लिए फार्मूला बार पर क्लिक करें
एडिट करने के बाद चेंज करने के लिए Enter दबाएँ,
एडिट को रिजेक्ट करने के लिए Esc दबाएँ।
Selecting Cell
Click Hold and drag over the cell which you want to select. After selecting one cell or more than one cell you can able to format that cell like format font face, color, size, alignment, number format etc. at once.
सेल को सिलेक्ट करना
उस सेल को क्लिक करके खींचें जिसे आप सिलेक्ट करना चाहते हैं. एक सेल या एक से अधिक सेल को सिलेक्ट करने के बाद आप उस सेल को फॉर्मेट कर सकते है जैसे फॉन्ट फेस, कलर, साइज़, अलाइन्मन्ट, नंबर फॉर्मैट आदि एकबार में बदलना।
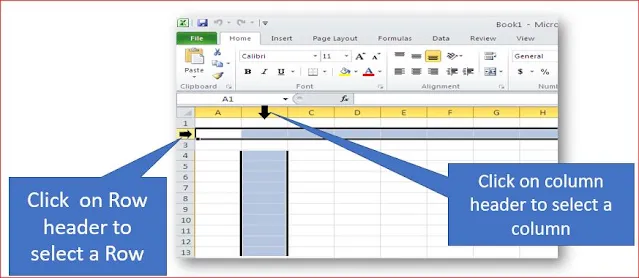
Selecting Column or Row
कॉलम या रो को सिलेक्ट करना
Manual Calculation
In Excel You can performing manual calculation with the following operators and starting with = (equal) sing in any cell.
Operators in Excel
+ Addition / Division
- Subtraction ^ Exponential
* Multiplication % Percentage
मैन्युअल गणना करना
Excel में आप निम्न ऑपरेटरों के साथ मैन्युअल गणना कर सकते हैं और किसी भी सेल में = (बराबर) साइन से स्टार्ट कर सकते हैं.
Excel में ऑपरेटर
+ जोड़ / भाग
- घटाव ^ घातीय, घातांक
* गुणा % प्रतिशत
Calculation in Excel
Excel में गणना करना
Inserting Row, Column or Cell
To insert cells, rows or columns in Excel
Place the cursor in the row below where you want the new row or in the column to the left of where you want the new column
Click the Insert Option on the Cells group of the Home tab
Click the appropriate choice: Cell, Row or Column
इन्सर्ट रो, कॉलम और सेल
Excel में सेल, रो और कॉलम इन्सर्ट करने के लिए
कर्सर को नीचे दी गई रो में रखें जहां आप नई रो चाहते हैं या कॉलम में बाईं ओर जहां आप नया कॉलम चाहते हैं।
होम टैब के सेल ग्रुप पर इन्सर्ट विकल्प क्लिक करें
उपयुक्त विकल्प पर क्लिक करें: सेल, रो और कॉलम
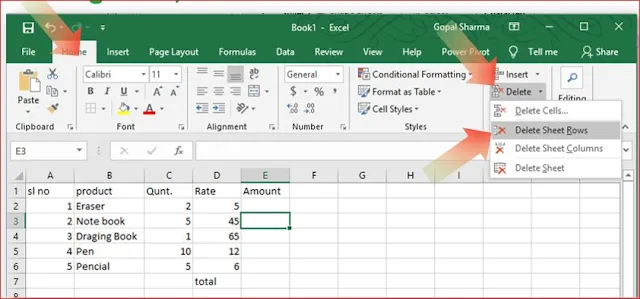
Deleting Row, Column or Cell
To Delete cells, rows or columns in Excel
Place the cursor in the cell, which cell, row or column you want to delete
Click the Delete Option on the Cells group of the Home tab
Click the appropriate choice: Cell, Row or Column
डिलीट रो, कॉलम और सेल
Excel में सेल, रो और कॉलम को हटाने के लिए
सेल में कर्सर रखें, जो सेल, रो या कॉलम आप हटाना चाहते हैं
होम टैब के सेल ग्रुप पर डिलीट विकल्प पर क्लिक करें
उपयुक्त विकल्प पर क्लिक करें: सेल, रो और कॉलम
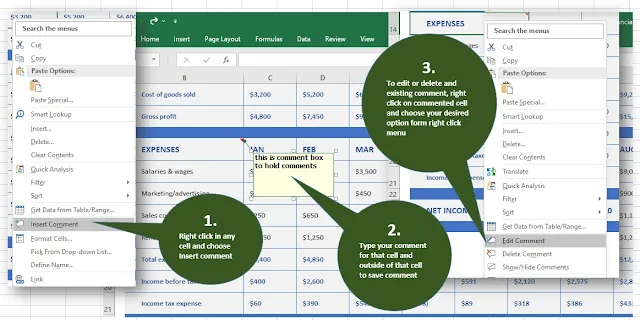
Working with comments
Comments are Pop-up notes that you can insert into your worksheet.
Right click on a cell where you want to add comment.
Choose Insert Comment option
Type your comment
When finished click on another cell.
कमेंट्स के साथ कार्य करना
कमेंट्स एक पॉप-अप नोट्स हैं जिन्हें आप अपने वर्क्शीट में इन्सर्ट कर सकते हैं.
उस सेल पर राइट क्लिक करें जहाँ आप कमेंट्स लाना चाहते हैं.
इन्सर्ट कमेन्ट विकल्प चुनें
अपने कमेन्ट लिखें
समाप्त होने पर किसी अन्य सेल पर क्लिक करें.
Excel Formulas
A formula is a set of mathematical instruction that can be used in Excel to perform calculations. Formula in excel is known as functions.
To create a basic formula in Excel
Select the cell for the formula
Type = (the equal sign) and the formula
Press Enter when finished.
You can also type a formula with help of formula bar.
इक्सेल फार्मूला
एक फार्मूला गणितीय निर्देश का एक सेट है जिसका उपयोग एक्सेल में गणना करने के लिए किया जा सकता है। एक्सेल में फार्मूला को फ़ंक्शन के रूप में जाना जाता है।
Excel में बेसिक फार्मूला बनाने के लिए
फार्मूला के लिए सेल का चयन करें
लिखे = (बराबर चिह्न) और फार्मूला
समाप्त होने पर Enter दबाएँ.
आप फार्मूला बार की सहायता से कोई फार्मूला भी लिख सकते हैं.
Elements in a Formula
References :- The cell or range of cells that you want to use in your calculation.
Operators : Symbols (+ - / * etc.) that specify the calculation to be performed
Constants : numbers or text value that do not change
Functions : predefined formulas in Excel
फार्मूला में तत्व
रेफ्ररेनसेज :- सेल या सेल का रेंज जिसे आप अपनी गणना में उपयोग करना चाहते हैं.
ऑपरेटर :- प्रतीक (+ - / * आदि) जो पर्फॉर्म की जाने वाली गणना को निर्धारित करते हैं
कॉन्सटेन्स :- संख्याएँ या टेक्स्ट वैल्यू जो परिवर्तित नहीं होते हैं
फंग्शनस :- Excel में पूर्वनिर्धारित फार्मूला
Auto Fill
The Auto Fill feature fills cell data or series of data in a worksheet into a selected range of cells.
Click the fill Handle
Drag the fill handle to complete the cells
ऑटो फिल
ऑटो फिल सुविधा सेल डेटा या वर्क्शीट में डेटा की सीरीज को सेलेक्टेड रेंज सेल में फिल करती है.
फिल वाले हैंडल पर क्लिक करें
सेल्स को पूरा करने के लिए फिल हैंडल को खींचें
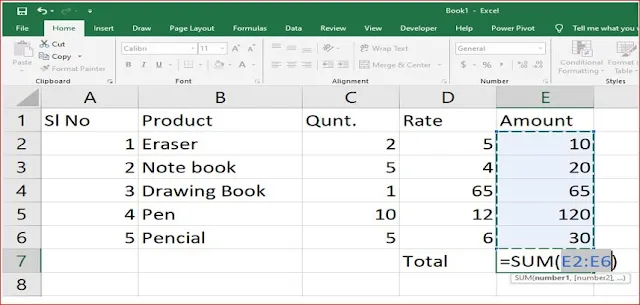
Auto Functions
A function is a built in formula in Excel. A function has a name and arguments (the mathematical function) in parentheses (bracket). Some common function in Excel:-
Sum: Calculate Sum of selected cell value
Average : Calculates the average of the cells in the argument
Min : Finds the minimum value in a range
Max : Finds the maximum value in a range
Count : Finds the number of cells that contain a numerical value within a range of the argument.
ऑटो फ़ंक्शंस
एक्सेल में फ़ंक्शन पहले से बने हुए फार्मूले होते हैें। एक फ़ंक्शन में कोष्ठक (ब्रैकेट) में एक नाम और तर्क (गणितीय फ़ंक्शन) होता है। Excel में कुछ सामान्य फ़ंक्शन हैं: –
सम : सेलेक्टेड सेल वैल्यू को जोड़ने के लिए प्रयोग होता है।
एवरेज : तर्क में सेल के औसत की गणना करता है
मिन : एक रेंज में न्यूनतम मान ज्ञात करता है
मैक्स: किसी रेंज में अधिकतम मान ज्ञात करता है
काउन्ट: किसी रेंज के उन सेल की संख्या ज्ञात करता है जिनमें संख्यात्मक मान होता है
Inserting Function with Insert Function box
Excel Provide two way to open Insert Function box.
Click Insert Function icon from formula bar
Click on Formula tab then click on Insert Functions tool.
इन्सर्ट फंगक्शन बॉक्स से फ़ंक्शन लाना
Excel, इन्सर्ट फंगक्शन बॉक्स खोलने के लिए दो तरीके प्रदान करता है।
फार्मूला बार से इन्सर्ट फ़ंक्शन आइकान पर क्लिक करके आप फन्सन बॉक्स को आप ऑपेन कर सकते है या तो फॉर्मूला टैब पर क्लिक करें फिर इन्सर्ट फ़ंक्शंस टूल पर क्लिक करें।
Project 2
Mathematical Function
SUM()
This function is used to add the numeric value in a range of cells.
Example : =sum(A1:A5)
AVERAGE()
This function is used to calculates the average of the numbers in a range of cells.
Example : =average(A1:A5)
MAX()
Returns the largest value in the range.
Example: =max(A1:A5)
MIN()
Returns the lowest value in the range.
Example: =min(A1:A5)
COUNT()
Counts the numbers of cells that contains numbers in the specified range
Example : =count(A1:A5)
COUNTA()
Counts the numbers of cells that are not
empty in the specified range.
Example : =counta(A1:A5)
COUNTBLANK()
Counts empty cells in a specified range of cells.
Example: =countblank(A1:A5)
गणितीय फंगक्शन
SUM()
इस फ़ंक्शन का उपयोग सेल की एक श्रेणी में संख्यात्मक मान जोड़ने के लिए किया जाता है।
उदाहरण : = SUM(A1:A5)
AVERAGE ()
इस फ़ंक्शन का उपयोग सेल की एक श्रृंखला में संख्याओं के औसत की गणना करने के लिए किया जाता है।
उदाहरण : = AVERAGE(A1:A5)
MAX()
रेंज में अधिकतम मान देता है।
उदाहरण: = MAX(A1:A5)
MIN()
रेंज में निम्नतम मान देता है।
उदाहरण: = MIN(A1:A5)
COUNT ()
निर्धारित श्रेणी में संख्याओं वाले सेल की संख्याओं की गणना करता है
उदाहरण : = COUNT (A1:A5)
COUNTA ()
उन कक्षों की संख्या गिनता है जो निर्धारित श्रेणी में रिक्त नहीं हैं.
उदाहरण : = COUNTA (A1:A5)
COUNTBLANK()
सेल की एक निर्धारित श्रेणी में खाली सेल की गणना करता है।
उदाहरण: = COUNTBLANK (A1:A5)
Text Function
Left()
Returns the specified numbers of characters from the left side of a text string.
Syntax: =left(text,[Num_chars]), Exp. =left(a1,5)
Right()
Returns the specified numbers of characters from the right side of a text string.
Syntax: =right(text,[Num_chars]), Exp. : =right(a1,5)
Proper()
Converts the first letter of each word in a text string to upper case.
Syntax: =proper(cell Address or Text) , Exp. : =proper(a1)
Upper()
Converts all lower case letters in a text string to upper case.
Syntax: =upper (cell Address or Text), Exp. : =upper(a1)
Lower()
Converts all uppercase letters in a text string to lowercase.
Syntax: =lower (cell Address or Text ), Exp. : =lower(a1)
Rept()
Repeats the given text a specified numbers of times.
Syntax: =rept(Text,[Num_Rept]), Exp. : =rept(a1,3)
टेक्स्ट फ़ंक्शन
Left()
टेक्स्ट स्ट्रिंग के बाईं ओर से वर्णों की निर्धारित संख्या देता है.
सिंटैक्स: =left(text,[Num_chars]), उदाहरण =left(a1,5)
Right()
टेक्स्ट स्ट्रिंग के दाईं ओर से वर्णों की निर्धारित संख्या देता है.
सिंटैक्स: =right(text,[Num_chars]), उदाहरण : =right(a1,5)
Proper()
टेक्स्ट स्ट्रिंग में प्रत्येक शब्द के पहले अक्षर को प्रोपर केस में कनवर्ट करता है।
सिंटैक्स: =proper(cell Address or Text) , उदाहरण : =proper(a1)
Upper()
टेक्स्ट स्ट्रिंग में सभी लोअर केस अक्षरों को अपर केस में कनवर्ट करता है।
सिंटैक्स: =upper (cell Address or Text), उदाहरण : =upper(a1)
Lower()
टेक्स्ट स्ट्रिंग में सभी अपर केस अक्षरों को लोअर केस में कनवर्ट करता है.
सिंटैक्स: =lower (cell Address or Text ), उदाहरण : =lower(a1)
Rept()
दिए गए टेक्स्ट को निर्धारित संख्या में दोहराता हैं ।
सिंटैक्स: =rept(Text,[Num_Rept]), उदाहरण : =rept(a1,3)
Logical Function
IF()
The function IF is used to determine whether a condition is true or false.
Syntax: if(logical test, Value_if_True, Value_if_false)
Example : =if (B2>300,”Pass”,”Fail”)
लॉजिकल फंसन
फंसन IF का उपयोग यह निर्धारित करने के लिए किया जाता है कि कोई स्थिति सही है या गलत।
सिंटैक्स: if(logical test, Value_if_True, Value_if_false)
उदाहरण: =if (B2>300,”Pass”,”Fail”)
Sumif and countif function
SUMIF()
It is used to find sum in a range of numeric cells based on a condition.
Syntax: =sumif(range,criteria,sum_range)
Example: =sumif(A2:A10, “DOCTOR”, C2:C10)
COUNTIF()
this function gives the count of the number of cells, which satisfies the condition
Syntax: =countif(range,criteria)
Example: =countif(A2:A10, “DOCTOR”)
समइफ और काउन्टइफ फंसन
SUMIF()
इसका उपयोग एक स्थिति के आधार पर संख्यात्मक सेल की रेंज में योग खोजने के लिए किया जाता है।
सिंटैक्स: =sumif(range,criteria,sum_range)
उदाहरण: =sumif(A2:A10, “DOCTOR”, C2:C10)
COUNTIF()
यह फ़ंक्शन सेल की संख्या की गिनती देता है, जो स्थिति को संतुष्ट करता है।
सिंटैक्स: =countif(range,criteria)
उदाहरण: =countif(A2:A10, “DOCTOR”)
Financial Function
FV() Function : Returns the future value of an investment based on periodic constant payments and a constant interest rate.
Syntax: FV(interest/condition, term, installment)
Example: =fv(11%/12,60,1000) result will be 79518.08
PMT() Function: calculates the payment for a loan based on constant payments and a constant interest rate.
Syntax : =PMT(rate,nper,pv,fv,type)
Example: =pmt(11%/12,60,100000) result will be 2174.24
PV() Function: Returns the present value of an investment.
Syntax : =PV(rate, nper, pmt, fv, type)
Example: =pv(11%/12,60,2174.24) result will be 99999.89
फाइनैन्शियल फंसन
FV() फंसन : आवधिक निरंतर भुगतान और निरंतर ब्याज दर के आधार पर निवेश के भविष्य के मूल्य को लौटाता है।
सिंटैक्स: FV(interest/condition, term, installment)
उदाहरण: =fv(11%/12,60,1000) परिणाम होगा 79518.08
PMT() फंसन: निरंतर भुगतान और निरंतर ब्याज दर के आधार पर ऋण के लिए भुगतान की गणना करता है।
सिंटैक्स: =PMT(rate,nper,pv,fv,type)
उदाहरण: =pmt(11%/12,60,100000) परिणाम होगा 2174.24
PV() फंसन: एक निवेश के वर्तमान मूल्य को वापस करता है।
सिंटैक्स: =PV(rate, nper, pmt, fv, type)
उदाहरण: =pv(11%/12,60,2174.24) परिणाम होगा 99999.89
Shorting Data
The Sort command arrange worksheet data by text, number, dates or times.
Shorting Data:
Select a cell in the column used to sort
From the Data command tab, in the Sort & Filter group, click Sort A to Z or Sort Z to A.
The selected column will be sorted.
शॉर्टिंग डेटा
शॉर्ट कमांड वर्क्शीट डेटा को टेक्स्ट, नंबर, दिनांक या समय के आधार पर व्यवस्थित करता है.
शॉर्टिंग डेटा:
शॉर्ट करने के लिए उपयोग किए जाने वाले कॉलम में किसी सेल को सिलेक्ट करें
डेटा कमांड टैब से, शॉर्ट एण्ड फ़िल्टर ग्रुप में, शॉर्ट A to Z में या शॉर्ट Z to A में क्लिक करें.
सेलेक्टेड कॉलम शॉर्ट (क्रमबद्ध) हो जाएगा.
Filtering Data
Using a filter allows you to work with a portion of the records in your data by extracting only records that match a set of criteria.
Filtering Data:
Click the column that contain the data you wish to filter
On the Home tab, click on Sort & Filter
Click Filter button
Click the Arrow at the bottom of the first cell
Set filter criteria
To clear filter click on Clear from Sort and Filter button.
फिलटरींग डेटा
फ़िल्टर का उपयोग करने से अपने डेटा में रिकॉर्ड के एक हिस्से के साथ काम कर सकते हैं जो फिल्टर के मानदंडों के सेट से मेल खाते हैं।
Filtering Data:
उस कॉलम को क्लिक करें जिसमें वह डेटा है जिसे आप फ़िल्टर करना चाहते हैं
होम टैब पर, सॉर्ट एण्ड फ़िल्टर पर क्लिक करें
फ़िल्टर बटन पर क्लिक करें
पहले सेल के निचले भाग में तीर पर क्लिक करें
फ़िल्टर मापदंड सेट करें
फ़िल्टर हटाने के लिए सॉर्ट और फ़िल्टर से क्लेयर बटन पर क्लिक करें.
Working with Pivot Table
A PivotTable report provides a dynamic summary of an existing table or data range that can be quickly expanded, collapsed and rearranged to give you several different perspectives on your data
Using PivotTableSelect that data which you want use to create PivotTable
Insert Tab > PivotTable > PivotTable
Pivot Table के साथ कार्य करना
PivotTable रिपोर्ट किसी मौजूदा तालिका या डेटा रेंज का एक गतिशील सारांश प्रदान करती है, जिसे आपके डेटा पर आपको कई अलग-अलग दृष्टिकोण देने के लिए शीघ्रता से विस्तारित, संक्षिप्त और पुनर्व्यवस्थित किया जा सकता है
PivotTable का उपयोग करना
उस डेटा का चयन करें जिसका उपयोग आप PivotTable बनाने के लिए करना चाहते हैं
Insert Tab > PivotTable > PivotTable
Using Shapes
To create shapes in Excel click on
Insert tab
Click on shapes tool in Illustration Group
Click on any shapes that you want to draw in your page.
Left Click hold and drag mouse over the page where you want to draw the shapes
Shapes का उपयोग करना
Excel में आकृतियाँ बनाने के लिए इन्सर्ट टैब पर क्लिक करें
इलस्ट्रैशन ग्रुप में shapes टूल पर क्लिक करें
उन shapes पर क्लिक करें जिन्हें आप अपने पेज में ड्रॉ करना चाहते हैं.
लेफ्ट क्लिक करें और माउस को उस पेज पर खींचें जहाँ आप shapes ड्रॉ करना चाहते हैं
Shape Customization
You can customize your shape color, size, angle etc. from format tab.
To customize a shape, click on that shape then choose your desire tool to customize. To add text on shapes, click on shape then type from keyboard.
Shape में कस्टमाइज़ेशन करना
आप फॉर्मैट टैब से अपने shape का रंग, आकार, कोण आदि कस्टमाइज़ कर सकते हैं।
किसी आकृति को कस्टमाइज़ करने के लिए, उस आकृति पर क्लिक करें और फिर कस्टमाइज़ करने के लिए अपना पसंद का टूल चुनें। आकृतियों पर टेक्स्ट जोड़ने के लिए, आकृति पर क्लिक करें और फिर कीबोर्ड से टाइप करें.
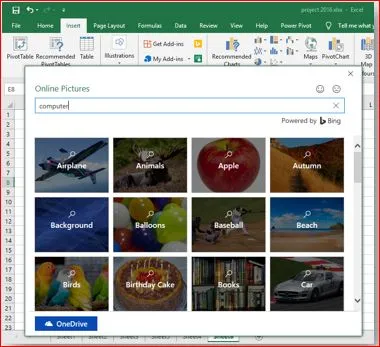
Working with Picture
MS-Excel provide two way to insert Image or Picture in your worksheet.
Offline : Insert Picture or Image from Your PC storage.
Online : Insert Picture from Internet.
चित्र के साथ कार्य करना
MS-Excel आपके वर्क्शीट में छवि या चित्र लाने के दो तरीके प्रदान करता है.
ऑफ़लाइन : अपने PC स्टॉरिज से चित्र या छवि लाना।
ऑनलाइन : इंटरनेट से चित्र लाना।
Picture customization
Use Format tab to customize your Picture like Picture Style, Shape, Color etc.
To activate format tab click on your Image or Picture or shape
Picture में कस्टमाइज़ेशन करना
अपने चित्र को कस्टमाइज़ करने के लिए फॉर्मैट टैब का उपयोग करें जैसे पिक्चर स्टाइल, आकार, रंग आदि बदलना
फॉर्मैट टैब को ऐक्टवैट करने के लिए अपनी छवि या चित्र या आकृति पर क्लिक करें
Using Smart Art
Click on Insert Tab --> Illustration --> Smart Art
The Choose a SmartArt Graphic dialog box will appear, choose a SmartArt then click ok.
स्मार्ट आर्ट का उपयोग करना
इन्सर्ट टैब पर क्लिक कारें --> इलस्ट्रैशन --> स्मार्ट आर्ट पर क्लिक करें
स्मार्टआर्ट ग्राफ़िक डाइअलॉग बॉक्स दिखाई देगा, कोई SmartArt चुनें फिर ओके पर क्लिक करें.
Using WordArt
Click on Insert Tab --> Text --> Word Art
Choose a style from dropped list of Word Art.
WordArt का उपयोग करना
इन्सर्ट टैब पर क्लिक कारें --> टेक्स्ट --> वर्ड आर्ट पर क्लिक करें
वर्ड आर्ट की ड्रॉप की गई लिस्ट से एक स्टाइल चुनें।
Chart in Excel
Excel can build a chart automatically based on existing data.
To Create Chart
Select the data
Insert Tab > Chart Group ( choose your chart type like column, Pie, Bar etc.)
Excel में चार्ट का उपयोग करना
Excel मौजूदा डेटा के आधार पर ऑटोमैटिक रूप से चार्ट बना सकते है.
चार्ट बनाने के लिए
डेटा का चयन करें
इन्सर्ट टैब >चार्ट ग्रुप पर (अपना चार्ट प्रकार चुनें जैसे स्तंभ, पाई, बार आदि)
Format Cell
You can change Fonts, Number style, Alignment with help of Format cell option
To Format a Cell Right Click on that cell or cells
Choose Format Cells from popup menu
Customize format for your cell
फॉर्मैट सेल
आप फ़ॉन्ट, नंबर स्टाइल, अलाइन्मन्ट आदि फ़ॉर्मेट सेल ऑप्शन की मदद से बदल सकते हैं
फॉर्मैट सेल करने के लिए उस सेल पर राइट क्लिक करें
पॉपअप मेनू से फॉर्मैट सेल चुनें
अपने सेल के लिए कस्टमाइज़ फॉर्मैट करें
.JPG)
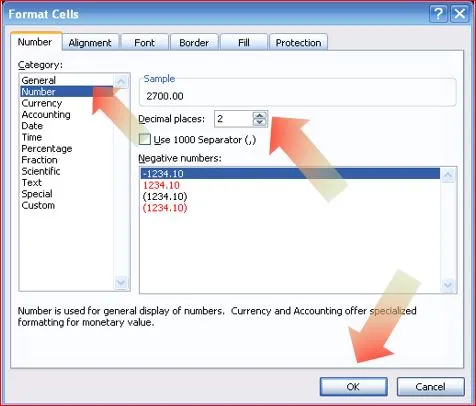
Format Cell (Number Tab)
Format Cells dialog box provide Six tab to format your cell
Number tab :- Allow for the display of different number
types and decimal places
फॉर्मैट सेल (नंबर टैब)
फॉर्मैट सेल डाइअलॉग बॉक्स आपके सेल को फॉर्मैट करने के लिए
छह टैब प्रदान
करता है
नंबर टैब: – विभिन्न संख्या के प्रकारों और दशमलव
स्थानों के दिखने की अनुमति देता है
Format Cell (Alignment Tab)
Alignment tab :- Allows for the horizontal and vertical alignment of text, wrap text, shrink text, merge cells and the direction of text
फॉर्मैट सेल (अलाइमेंट टैब)
अलाइमेंट टैब :- टेक्स्ट के हॉरिजॉन्टल और वर्टिकल अलाइमेंट के साथ, रैप टेक्स्ट, श्रिंक टेक्स्ट, मर्ज सेल और टेक्स्ट डयरेक्शन करने की अनुमति देता है
Format Cell (Font Tab)
Font tab :- Allows for control of font style, size, color and additional features
फॉर्मैट सेल (फ़ॉन्ट टैब)
फ़ॉन्ट टैब: - फ़ॉन्ट स्टाइल, साइज़ , रंग और अतिरिक्त सुविधाओं के कंट्रोल करने की अनुमति देता है
Format Cell (Border Tab)
Border tab :- Allows for control border styles and colors
फॉर्मैट सेल (बॉर्डर टैब)
बॉर्डर टैब: - बॉर्डर स्टाइल और बॉर्डर का रंग बदलने की अनुमति देता है
Format Cell (Fill Tab)
Fill tab :- Allows for control of cell fill colors and styles
फॉर्मैट सेल (फिल टैब)
फिल टैब: - सेल में रंग और सेल स्टाइल बदलने की अनुमति देता है
Paste Special
MS-Excel Provide different types of Paste Mode. Paste Mode are known as Paste Special in Excel. Some Paste Mode are listed bellow.
पेस्ट स्पेशल
MS-Excel विभिन्न प्रकार के पेस्ट मोड प्रदान करता है. पेस्ट मोड को एक्सेल में पेस्ट स्पेशल के रूप में जाना जाता है। कुछ पेस्ट मोड नीचे लिस्टेड हैं।
Paste Special (Transpose)
Transpose is Paste Special mode in Excel to Paste Row Data in Column Format and vise-Versa.
पेस्ट स्पेशल (ट्रांसपोज)
ट्रांसपोज एक पेस्ट स्पेशल मोड है जो की रो डेटा को कॉलम फॉर्मैट और इसके विपरीत करने की अनुमति देता है
VLOOKUP Function
VLOOKUP looks for a value in the leftmost column of a table, and then returns a value in the same row from a column you specify. By default, the table must be sorted in an ascending order.
Syntax:
=VLOOKUP(lookup_value, table_array, Col_index_num, range_lookup)
VLOOKUP फंगक्शन
VLOOKUP किसी तालिका के सबसे बाएँ कॉलम में कोई मान ढूँढता है, और तब आपके द्वारा निर्धारित कॉलम से उसी रो में कोई मान देता है. डिफ़ॉल्ट रूप से, टेबल को आरोही क्रम में सॉर्ट किया होना चाहिए।
सीनटेक्स :
=VLOOKUP(lookup_value, table_array, Col_index_num, range_lookup)
Sample Data for VLOOKUP Function
VLOOKUP फ़ंक्शन के लिए नमूना डेटा
Using VLOOKUP Function
VLOOKUP फ़ंक्शन का उपयोग करना
Inserting VLOOKUP Function
VLOOKUP फ़ंक्शन सम्मिलित करना
Result after using VLOOKUP Function
VLOOKUP फ़ंक्शन का उपयोग करने के बाद परिणाम
Freeze Row or column
To Freeze a row or column
Click the Freeze Panes button on the View Tab.
Click on Top Row or First Column as your need
To unfreeze, click the Unfreeze from Freeze Panes button
रो या कॉलम फ़्रीज़ करें
किसी रो या कॉलम को फ़्रीज़ करने के लिए
व्यू टैब पर फ़्रीज़ पैन बटन पर क्लिक करें.
अपनी आवश्यकता के अनुसार टॉप रो या फर्स्ट कॉलम पर क्लिक करें
अनफ़्रीज़ करने के लिए, फ़्रीज़ पैन से अनफ़्रीज़ बटन पर क्लिक करें
Hide / Unhide Worksheet
To hide a worksheet
Select the tab of the sheet you wish to hide
Right-click on the tab
Click Hide
To Unhide a worksheet
Right click on any worksheet tab
Click unhide
Choose the worksheet to unhide
वर्कशीट को हाइड / अनहाइड
वर्कशीट को हाइड करने के लिए
उस शीट के टैब का सिलेक्ट करें जिसे आप छिपाना चाहते हैं
टैब पर राइट-क्लिक करें
हाइड पर क्लिक करें
वर्कशीट को हाइड करने के लिए
किसी भी वर्कशीट टैब पर राइट क्लिक करें
अनहाइड पर क्लिक करें
अनहाइड करने के लिए वर्कशीट चुनें
Workbook Views Setup
Excel Provide following way to setup your Page View for Print or Work
Normal View
Page Break View
Page Layout View and
Custom View
वर्कशीट व्यू सेटअप
Excel अपने पेज व्यू को प्रिंट या वर्क के लिए सेटअप करने का निम्न तरीका प्रदान करता है
नॉर्मल व्यू
पेज ब्रेक व्यू
पेज लेआउट व्यू और
कस्टम व्यू
How to Print a workbook
To Print Your work from workbook first select the cells and than click on Page Layout --> Print Area --> Set Print Area
Than click on Print from File Tab
वर्कबुक को प्रिंट कैसे करें
वर्कबुक से अपना वर्क प्रिंट करने के लिए, पहले सेल को सिलेक्ट करें और उसके बाद पेज लेआउट पर क्लिक कारें --> प्रिंट एरिया पर क्लिक करें --> प्रिंट एरिया सेट करें
उसके बाद फ़ाइल टैब से प्रिंट पर क्लिक करें
Final Project-1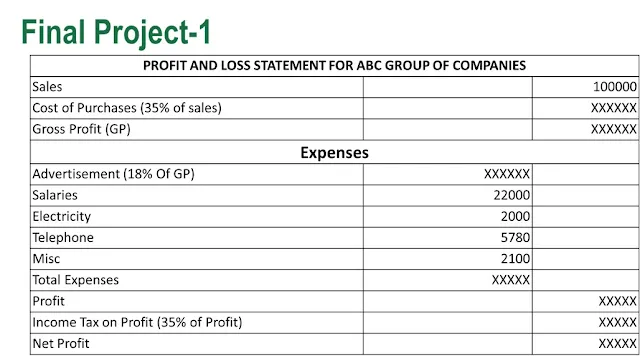
Question of Final Project -1
- Cost of Purchases = 35% of Sales.
- Gross profit(GP) = Sales – Cost of Purchase.
- Advertisement =18% of Gross Profit (GP).
- Total Expenses = Advertisement + Salaries + Elec. + Telephone + Misc.
- Profit = Gross Profit – Total Expenses.
- Income Tax = 35% of Profit.
- Net Profit = Profit – Income Tax.
Question of Final Project -1
- खरीद की लागत = बिक्री का 35%
- सकल लाभ (जीपी) = बिक्री - खरीद की लागत।
- विज्ञापन = सकल लाभ (जीपी) का 18%
- कुल व्यय = विज्ञापन + वेतन + वेतन + टेलीफोन + विविध
- लाभ = सकल लाभ – कुल व्यय।
- आयकर = लाभ का 35%
- शुद्ध लाभ = लाभ – आयकर।
Final Project -2
Question of Final Project -2
- DA = 75% OF BASIC , HRA = 40% OF BASIC,
- PF = 10% OF BASIC
- Total salary = BASIC + HRA + DA – PF
- Loan AMT = 30 times of Total for employees whose Total is above Rs 4500.
🤔 {=if(TOTAL > 4500, TOTAL*30,0) } - Loan AMT paid = calculate loan repaid per months if interest rate is 5% and term =180 months
🤔 = PMT(5%/12,180,loan AMT) - Rename the sheet 1 to as January.
- Insert a FBONUS column before the PF column
- FBONUS = 25% of basic if Basic is more than Rs. 2700.
🤔= if(basic> 2700, 25%*basic, 0) - Net salary = Total + Fbonus – Loan AMT Paid
- Format Amounts as two decimal place
अंतिम परियोजना -2 का प्रश्न
डीए = मूल का 75%, एचआरए = बेसिक का 40%, पीएफ = बेसिक का 10%
कुल वेतन = बेसिक + एचआरए + डीए – पीएफ
लोन एएमटी = उन कर्मचारियों के लिए कुल का 30 गुना जिनका कुल योग 4500 रुपये से ऊपर है।
= यदि (कुल > 4500, कुल *30,0)
भुगतान किया गया ऋण एएमटी = प्रति माह चुकाए गए ऋण की गणना करें यदि ब्याज दर 5% है और अवधि = 180 महीने
= पीएमटी (5%/12,180, ऋण एएमटी)
पत्रक 1 का नाम बदलकर जनवरी कर दें.
पीएफ कॉलम के पहले एक एफबोनस कॉलम डालें
एफबोनस = मूल का 25% यदि मूल 2700 रुपये से अधिक है।
= यदि (बुनियादी> 2700, 25% * बुनियादी, 0)
शुद्ध वेतन = कुल + एफबोनस – ऋण एएमटी का भुगतान
राशियों को दो दशमलव स्थान के रूप में स्वरूपित करें











.JPG)
.JPG)
.JPG)
.JPG)
.JPG)

.JPG)


